Friday, February 19, 2016

Week 6


Blogsheet week 6
Operational Amplifiers

Explanations of the pin numbers are below:

1: DO NOT USE
8: DO NOT USE
2: Negative input
7: +10V
3: Positive input
6: output
4: -10 V
5: DO NOT USE


1. You will use the OPAMP in “open-loop” configuration in this part, where input signals will be applied directly to the pins 2 and 3.

a.       Apply 0 V to the inverting input. Sweep the non-inverting input (Vin) from -10 V to 10 V with 1 V steps. Take more steps around 0 V (both positive and negative). Create a table for Vin and Vout. Plot the data (Vout vs Vin). Discuss your results. What would be the ideal plot?


      Table 1                                                   Graph 1: Inverting graph in open loop

Vin (V)
Vout (V)
-5
4.68
-4
4.68
-3
4.68
-2
4.68
-1
4.68
-0.5
4.68
0
0
0.5
-3.77
1
-3.77
2
-3.77
3
-3.77
4
-3.77
5
-3.77


In our graph, the slope of the plot should be close to 0. As shown above, the slope of our graph should've been closer to 0, but the outcome of what we have shown in the graph may be from the lack of more data between 0 and +/- 1 V. However, Vout flattens out at 4.68 V at -5V and -3.77 V at 5 V. This occurs because the output can only go so high/low, thus flattening out at the maximum/minimum values. This may also be because of the type of equipment we use. Since it is an inverting input, our output should be the opposite of our input, which our chart clearly shows.


b.      Apply 0 V to the non-inverting input. Sweep the inverting input (Vin) from -10 V to 10 V with 1 V steps. Take more steps around 0 V (both positive and negative). Create a table for Vin and Vout. Plot the data (Vout vs Vin). Discuss your results. What would be the ideal plot?


Table 2:                                                  Graph 2: Non-inverting graph in open loop

Vin (V)
Vout (V)
-5
-3.77
-4
-3.77
-3
-3.77
-2
-3.77
-1
-3.77
-0.5
-3.77
0
0
0.5
4.68
1
4.68
2
4.68
3
4.68
4
4.68
5
4.68

Our plot should be similar to the plot above, however the output will be positive and negative respective to the input because the input is non-inverting. The slope should've been closer to 0 also. As shown in our table, when Vin is negative, Vout will also be negative, and same for when Vin is positive.


2.       Create a non-inverting amplifier. (R2 = 2 kΩ, R1 = 1 kΩ). Sweep Vin from -10 V to 10 V with 1 V steps. Create a table for Vin and Vout. Plot the measured and calculated data together.


Table 3:                                                  Graph 3:Non-inverting with resistor values

Vin (V)
Vout (V)
-5
-3.77
-4
-3.77
-3
-3.77
-2
-3.77
-1
-3.77
-0.5
-3.77
0
0
0.5
4.68
1
4.68
2
4.68
3
4.68
4
4.68
5
4.68


In our table,  Vout are positive and negative respectively since it's non-inverting. When Vin is negative, Vout will also be negative; when Vin is positive, Vout is positive.


3.       Create an inverting amplifier. (Rf = 2 kΩ, Rin = 1 kΩ). Sweep Vin from -10 V to 10 V with 1 V steps. Create a table for Vin and Vout. Plot the measured and calculated data together.


Table 4:                                                   Graph 4: Inverting with resistor values

Vin (V)
Vout (V)
-5
4.13
-4
4.13
-3
4.13
-2
4.13
-1
2.91
-0.5
-1.5
0
0.8 mV
0.5
-2.91
1
-3.5
2
-3.5
3
-3.5
4
-3.5
5
-3.5

When Vin is negative, Vout is positive; when Vin is positive, Vout is negative. This is because it's inverting. 


4.       Explain how an OPAMP works. How come is the gain of the OPAMP in the open loop configuration too high but inverting/non-inverting amplifier configurations provide such a small gain?


      An OPAMP works by amplifying the input voltage, but it can’t exceed the +/- 5 voltage source. It levels out at a certain point. The resistors affects the gain in the inverting/non-inverting amplifier while in the open loop, it doesn’t affect the gain. Since open loop is infinite, the gain will be much higher.


5.
Temperature Sensor: Put TMP36 temp sensor on breadboard.
·         Connect the +VS to 5 volts and GND to ground.

·         Using a voltage meter, measure the output voltage from the VOUT. Now put your finger (or cover the sensor with your palm) on the TMP36 temperature sensor for a while, observing how the output voltage changes. Check Fig. 6 in the data sheet (EXPLAIN).

6.   Connect your DC power supply to pin 2 and ground pin 5. Set your power supply to 0V.           Switch your multimeter to measure the resistance mode; use your multimeter to measure the       resistance between pin 4 and pin 1. Do the same measurement between pin 3 and pin 1.               Explain your findings (EXPLAIN). 

  • The resistance between pin 4 and pin 1 is 0.35 Ω, so basically 0 Ω because voltage is set at 0 V and pin1 and 4 are normally closed.
  • The resistance between pin 3 and pin 1 is infinite, because pin 1 and 3 are normally open.


7.   Now sweep your DC power supply from 0V to 8V and back to 0V. What do you observe at       the  multimeter (resistance measurements similar to #1)? Did you hear a clicking sound?             How many times? What is the “threshold voltage values” that cause the “switching?” (EXPLAIN with a VIDEO).
Video 1: Sweeping DC power supply to cause clicking sound


8.  How does the relay work? Apply a separate DC voltage of 5 V to pin 1. Check the voltage            value of pin 3 and pin 4 (each with respect to ground) while switching the relay (EXPLAIN with a VIDEO).


Video 2: Explanation of relay with basic drawings 


LED + Relay
1.       Connect positive end of the LED diode to the pin 3 of the relay and negative end to a 100 ohm resistor. Ground the other end of the resistor. Negative end of the diode will be the shorter wire.
2.       Apply 3 V to pin 1

3.       Turn LED on/off by switching the relay. Explain your results in the video. Draw the circuit schematic (VIDEO)

Video 3: Explanation of turning the LED on/off with relay


Operational Amplifier (data sheet under Bb/week 6)
1.       Connect the power supplies to the op-amp (+10V and -10V). Show the operation of LM 124 operational amplifier in DC mode with a non-inverting amplifier configuration. Choose any opamp in the IC. Method: Use several R1 and R2 configurations and change your input voltage and record your output voltage. (EXPLAIN with a TABLE)


R1:  1.2 kΩ  R2: 2 kΩ
Vin
0 V
2 V
5 V
7 V
8 V
10V
Vout
79  mV
5.7 V
9.1 V
9.1 V
9.1 V
9.1 V


R1: 47 Ω   R2: 357 Ω
Vin
0 V
2 V
5 V
7 V
8 V
10 V
Vout
0 V
8.5 V
8.5 V
8.5 V
8.5 V
8.5 V


       When using the same Vin values, our Vout values are different when using different resistor values.


1.       Use your temperature sensor as your input. Do you think you can generate enough voltage to trigger the relay? (EXPLAIN)
Yes, you can generate enough voltage to trigger the relay. The heat applied to the temperature sensor increases the output voltage, causing the relay to trigger. Without heat, the voltage at first is low, starting around 1.6 V, but when we applied heat from the hair dryer, the voltage began to increase drastically. 

2.       Design a system where LED light turns on when you heat up the temperature sensor. (CIRCUIT schematic and explanation in a VIDEO)

Video 4: Schematic of the system and explanation


1.       BONUS! Show the operation of the entire circuit. (VIDEO)

Video 5: Run through of our circuit

Thursday, February 11, 2016

Week 5

Blog sheet week 5

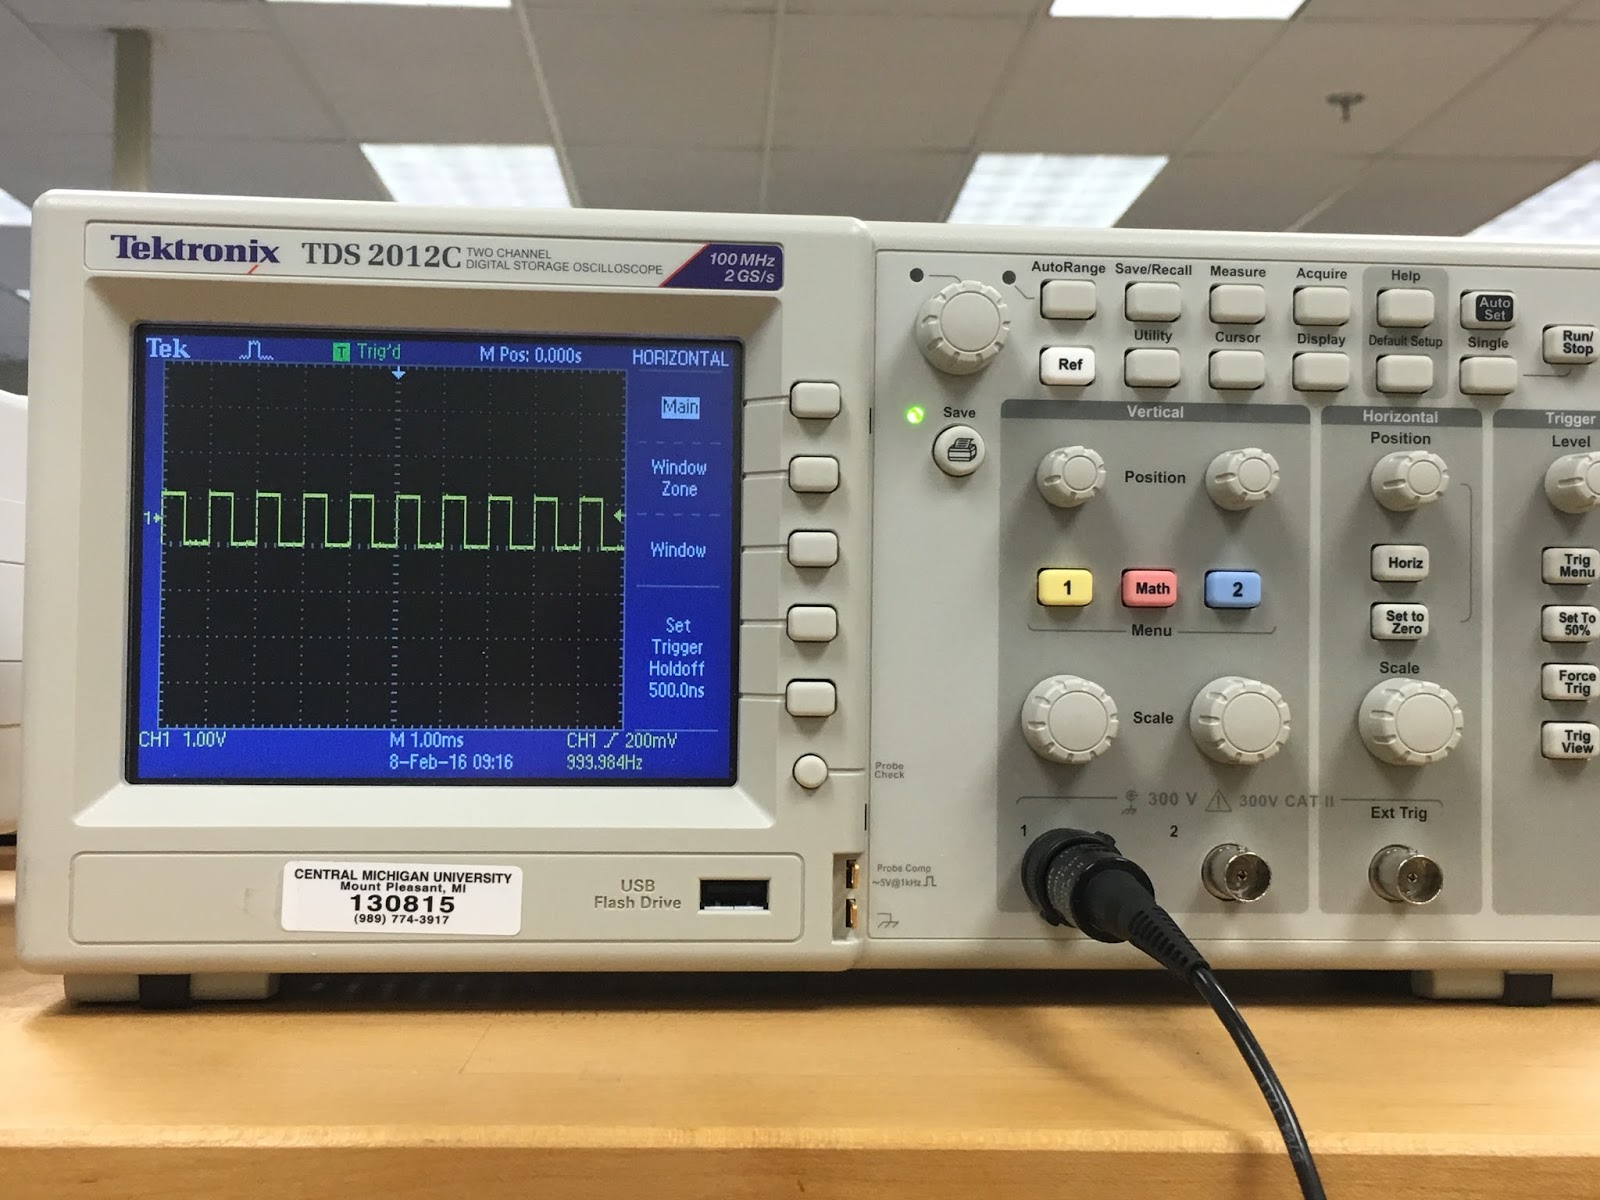
1.       Functional check: Oscilloscope manual page 5. Perform the functional check (photo).


Image 1: Functional check on oscilloscope


Image 2: Square wave in display of 5V at 1 kHz.
Note: Wave in picture was moving, hence the odd overlapping look


2.       Perform manual probe compensation (Oscilloscope manual page 8) (Photo of overcompensation and proper compensation).


Image 3: Proper compensation


Image 4: Overcompensation


3.       What does probe attenuation (1x vs 10x) do (Oscilloscope manual page 9)?
Probe attenuation affects the vertical scale of the signal. When set to 1X, the probe limits the bandwidth of the oscilloscope to 7 MHz, while the 10X allows the probe to use the full bandwidth of the oscilloscope.


4.       How do vertical and horizontal controls work? Why would you need it (Oscilloscope manual pages 34-35)?

  • The vertical controls shifts the wave up or down 
  • The horizontal controls shifts the wave to left or right
We need these controls because it adjusts the waveform to what you want. The vertical controls allows you to see the whole wave while the horizontal controls allows you to fixate on a certain section, making it easier to measure one period. You can adjust the functions to give you more than one wave at a time. They can overlap each other or have one wave sit below or above the other wave for comparison.


5.       Generate a 1 kHz, 1 Vpp around a DC 2 V from the function generator (use the output connector). DO NOT USE oscilloscope probes for the function generator. There is a separate BNC cable for the function generator.
a.       Connect this to the oscilloscope and verify the input signal using the horizontal and vertical readings (photo).
b.      Figure out how to measure the signal properties using menu buttons on the scope.


a. 
Image 5: Our signal with 1 kHz and 1 Vpp around DC 2V

Image 6: Amplitude is reading at 0.5 V
b. When measuring the signal properties, you press Measure, source CH 1, and then press Type to cycle through the properties and find what you want


6.       Connect function generator and oscilloscope probes switched (red to black, black to red). What happens? Why?
When we did this, we don't get a signal. This occurs because each probe that is grounded is being connected to the other probes, thus grounding the signal. 


Image 7: Oscilloscope showing our finding 


7.       After calibrating the second probe, implement the voltage divider circuit below. Measure the following voltages using the Oscilloscope and comment on your results:

We used an amplitude of 0.5 V and an offset of 0.25 V.

a.       Va and Vb at the same time (Photo)
b.      Voltage across R4.


a.) 
 
Image 8: Two waves at the same time


b.) For our resistors, we couldn’t find two extra 1k, so we had use two 820 Ω resistors. We measured the voltage across R4 to be 233 mV-118mV = 115 mV


8.       For the same circuit above, measure Va and Vb using the handheld DMM both in AC and DC mode. What are your findings? Explain.
In AC: 
Va
Vb
111.7 mV
224.4 mV
                                   
In DC:
Va
Vb
15.9 mV
31.8 mV

For AC, we applied 0.5 V peak to peak, seeing that the maximum applied voltage of AV is 0.25 V. For DC, the voltage should've been split evenly among the two resistors because they have the same resistance. 

9.       For the circuit below
a.       Calculate R so given voltage values are satisfied. Explain your work (video)
b.      Construct the circuit and measure the values with the DMM and oscilloscope (video). Hint: 1kΩ cannot be probed directly by the scope. But R6 and R7 are in series and it does not matter which one is connected to the function generator.


a.
Video 1: Calculating R

b.


Video 2: Measuring with the DMM and Oscilloscope


10.   Operational amplifier basics: Construct the following circuits using the pin diagram of the opamp. The half circle on top of the pin diagram corresponds to the notch on the integrated circuit (IC). Explanations of the pin numbers are below:
1: DO NOT USE
8: DO NOT USE
2: Negative input
7: +10V
3: Positive input
6: output
4: -10 V
5: DO NOT USE


a.       Inverting amplifier: Rin = 1kΩ, Rf = 5kΩ (do not forget -10 V and +10 V). Apply 1 Vpp @ 1kHz. Observe input and output at the same time. What happens if you slowly increase the input voltage up to 5 V? Explain your findings. (Video)


Video 3: Inverting Amplifier

b.      Non-inverting amplifier: R1 = 1kΩ, R2 = 5kΩ (do not forget -10 V and +10 V). Apply 1 Vpp @ 1kHz. Observe input and output at the same time. What happens if you slowly increase the input voltage up to 5 V? Explain your findings. (Video)


Video 4: Non-inverting Amplifier

Thursday, February 4, 2016

Week 4

Blog sheet week 4

1.       (Table and graph) Use the transistor by itself. The goal is to create the graph for IC (y axis) versus VBE (x axis). Connect base and collector. Use 10K potentiometer to generate the voltage. Use 5 V but DO NOT EXCEED 1 V for VBE. Make sure you have the required voltage value set before applying it to the base. Transistor might get really hot. Do not TOUCH THE TRANSISTOR! Make sure to get enough data points to graph. (Suggestion: measure for VBE = 0V, 0.5V, and 1V and fill the gaps if necessary by taking extra measurements). The circuit should look like below:


According to our table, our graph will be an exponential relationship between Ic and VBE. Ic is determined by the value of VBE 

Table 1: Relationship between VBE and IC

VBE
IC
0V
0.0004 mA
0.23V
0.0005 mA
0.5V
0.0008 mA
0.6V
0.036 mA
0.62V
0.07 mA
0.81V
13.42 mA


Graph:
Graph 1:  Ic vs VBE 

2.       (Table and graph) Create the graph for IC (y axis) versus VCE (x axis). Vary VCE from 0 V to 5 V. Do this measurement for 3 different VBE values: 0V, 0.7V, and 0.8V. The circuit should look like below:


 According to our table, the relationship between Ic and VBE stays the same. However, with VCE involved, it doesn’t affect the outcome of Ic. Instead of an exponential line, the result contains multiple horizontal lines.

Table 2: Relationship between VBE and Ic with VCE
VCE
VBE
Ic
0
0V
0 mA
1V
0.2V
0 mA
2V
0.7V
22.2 mA
2V
0.8V
35.6 mA


Graph:

Graph 2: Ic vs  VCE


3.       (Table) Apply the following bias voltages and fill out the table. How is IC and IB related? Does your data support your theory?

a

Table 3: Relationship between IC and IB with VCE and VBE
VBE
VCE
Ic
IB
0.7 V
2 V
38.1 mA
0.037 mA
0.75 V
2 V
49.1 mA
0.655 mA
0.8 V
2 V
49.2 mA
1.47 mA

Ic and IB are related by being a ratio equally to current gain, where current gained doesn't change if the voltage value changes. It was a little difficult trying to read the current measurements because the readings were jumping all over the place. Our data for the most part supports our theory since our values for Ic were fairly close.
IC/IB= β


4.       (Table) Explain photocell outputs with different light settings. Create a table for the light conditions and photocell resistance.


Table 4: Different light sources with photocell resistance
Light Setting
Photocell Resistance
No light
17.1 kΩ
Room light
2.5 kΩ
Flashlight (iPhone)
40 Ω

As you can see, the darker it is, the more resistance there is of the photocell.


5.       (Table) Apply voltage (0 to 5 V with 1 V steps) to DC motor directly and measure the current using the DMM.


      Table 5: Different voltages applied to the DC motor with current measurements
Voltage Applied
DC Motor Current
0 V
0 mA
1 V
26 mA
2 V
31.2 mA
3 V
34.4 mA
4 V
37.3 mA
5 V
39 mA

According to our table, the higher the voltage, the higher the DC motor current. This supports Ohm's Law, where voltage and current are directly related.


6.       Apply 2 V to the DC motor and measure the current. Repeat this by increasing the load on the DC motor. Slightly pinching the shaft would do the trick.


Table 6: Same voltage is applied to the DC motor, but the second measurement has an increased load on the motor
Voltage
Current Measured
2 V
30.1 mA
2 V (pinched)
57.5 mA


When the motor was pinched, the current measurement increased; the amount of pressure on the motor determines how much current there is. If you were to slightly pinch it, there shouldn't be that much of a change of the current value. Pinching the motor harder would cause the motor to have a greater amount of current flowing through it than the 57.5 mA we've measured above.


7.       (Video) Create the circuit below (same circuit from week 1). Explain the operation in detail.


Video 1: Operation of the circuit


8.       Explain R4’s role by changing its value to a smaller and bigger resistors and observing the voltage and the current at the collector of the transistor.


 R4’s role is to limit the voltage and current going into the collector.

  • When R4 is smaller (47 Ω), the DC motor will spin. The voltage at the collector of the transistor is 9.44 V and the current at the collector is 29.2 mA
  • When R4 is larger (1 kΩ), the DC motor won’t do anything. The voltage at the collector of the transistor is about 4 V and the current at the collector is 3.0 mA

9.       (Video) Create your own Rube Goldberg setup.

    
       In our Rube Goldberg setup, the DC motor acts as a pulley, raising an object (in this test run, a paper flag). The DC motor would spin if there is a light source hitting the photosensor, and wouldn't spin if there's no light source.


Video 2: Test run of our Rube Goldberg setup